


Introduction
A key requirement of a data exchange is good platform performance. Deciding what is good performance is usually determined by the data characteristics and query statistics. Serving a hundred small JSON documents per second may be considered slow, while serving a hundred 5-minute-long video files per second could be considered as excellent performance. There are various metrics which can be used to describe the performance of a data exchange such as requests per second. Different performance testing strategies are used to find bottlenecks in platforms which do not meet adequate performance metrics. We often turn to debuggers (or print statements) when trying to fix logic bugs when writing applications. But what happens when we find performance issues when load testing or stress testing the application? Using a debugger or observing debug logs may help, but they may not be enough. If a close reading of the code does not help in finding the issue, profiling the application would be the next best step to take. This article aims to provide a technical overview to profile Java applications using Async Profiler and how to interpret the results in the form of flame graphs.Async Profiler
Async Profiler is the profiler we are going to use. Apart from being actively developed and easy to use, the main advantage of Async Profiler is that it avoids safepoint bias when profiling. Understanding what safepoints in the JVM are is beyond the scope of this article, so take a look at this article to learn more about them.Flame Graphs
After profiling the application, we need a way to interpret the results. Flame graphs were pioneered by Brendan Gregg as an intuitive way to visualize and interact with profiling results. I highly recommend his article that explains the motivations behind the creation of flame graphs and how to gather insights from them.public class FlameTest {
public static void divisibleByTwo() {
System.out.println("Divisible by 2");
return;
}
public static void divisibleByFive() {
System.out.println("Divisible by 5");
return;
}
public static void main(String[] args) {
int i = 1;
while (i < 10000) {
if (i % 2 == 0) {
divisibleByTwo();
} else if (i % 5 == 0) {
divisibleByFive();
}
i++;
}
}
}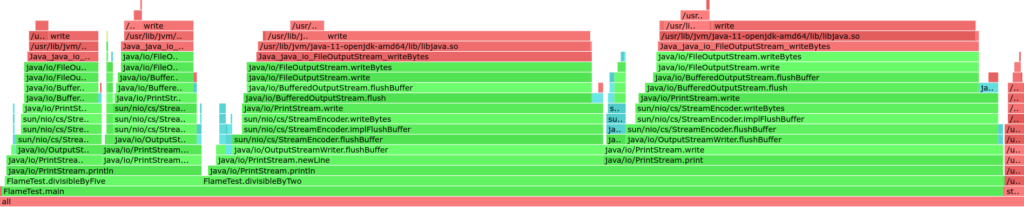
Fig: Flame graph generated from profiling FlameTest
Observe the different method names that are present across the graph. Methods that are on top of each other are nested method calls. There are the methods that we have written like divisibleByTwo and divisibleByFive, internal Java methods and Linux system calls. As a simple rule-of-thumb, the wider a method is on the x-axis, the more time it spent being processed by the CPU during profiling. Similarly, taller lists of functions denote deeply-nested method calls. Notice that divisibleByTwo is much larger than divisibleByFive in the flame graph. Since there are more numbers divisible by 2 than 5 from 1 to 10000, divisibleByTwo was present on the CPU more often than divisbleByFive. In the way that we notice expected behaviour when profiling this program, we can discover unexpected behaviour when profiling real world applications.Setting up and using Async Profiler
You can download async profiler from here for the appropriate architecture. Once downloaded and unzipped, the profiler.sh script is what we would use.- Start your Java application normally and then find out the PID of the associated running process (you can use jps, ps aux or htop for this).
- Start profiling the application by calling sh with the PID of the process. Note that we configure Async Profiler with the itimer event flag. The preferred way is to set it to cpu, but this requires a little more work to configure. itimer is good enough for quick tests, but it’s advised to use cpu when you need more accurate results.
- Once profiling has started, we need to execute the code paths that are to be inspected. Since we are testing a web server here, a tool like jMeter or wrk can be configured to call the API repeatedly for some amount of time or for n number of requests. Ensure that the code path is hit a good number of times so that an accurate profiling result can be obtained.
- We can stop the profiling once we feel that the application has been adequately tested. Async Profiler allows us to stop profiling and immediately dump the results as a flame graph in a HTML file.
A profiling example
We have a web server written in Vert.x that serves a 50MB file called sample in a directory called files. On Linux we can quickly create such a file with the command head -c 50M /dev/random > sample
package com.example.profilertest;
import io.vertx.core.AbstractVerticle;
import io.vertx.core.Promise;
import io.vertx.core.http.HttpServer;
import io.vertx.core.http.HttpServerResponse;
import io.vertx.ext.web.Router;

public class MainVerticle extends AbstractVerticle {
  @Override
  public void start(Promise startPromise) throws Exception {
    HttpServer server = vertx.createHttpServer();
    Router router = Router.router(vertx);
    router.route("/files/sample").handler(ctx -> {
      HttpServerResponse response = ctx.response();
      // Write to the response and end it
      vertx.fileSystem().readFile("files/sample").onSuccess(file -> {
        response.end(file);
      }).onFailure(fail -> {
        response.setStatusCode(500).end();
      });
    });
    server.requestHandler(router).listen(8080);
  }
}
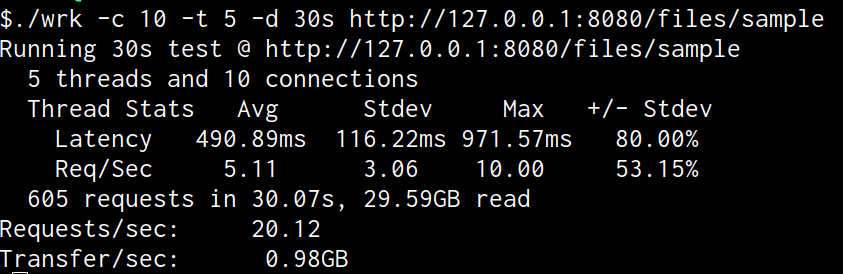
Fig: Using wrk to test the API without profiling
A performance of 5 requests per seconds is quite poor, even for such a simple API. Using the steps from the previous section, we can tell Async Profiler to start profiling the server, use wrk again to call the API, stop profiling and view the resulting flame graph.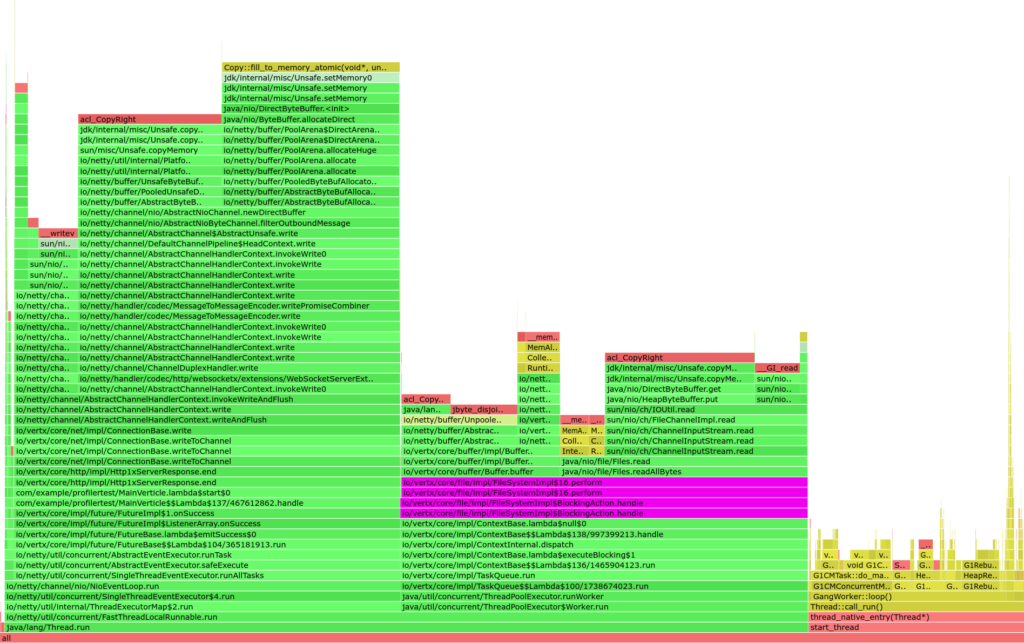
Fig: Flame graph generated from profiling the server
We see that the file-system methods dominate the processing time. You may have already guessed it; reading from the file system at every API call is surely a bottleneck.Where profiling comes handy
Profiling really shines when trying to find non-obvious performance bottlenecks in applications. Some bottlenecks are quite easy to spot when you read the code, like a nested loop. But profiling combined with a good visualization tool like flame graphs gives an idea of what our application is doing under the hood and therefore aids in rooting out the issue. There have been several times that profiling has come to the rescue at IUDX when debugging performance issues. Some of the instances it’s been useful are:- When an application is using a library that we don’t have much experience with. When we include a library in our application, and observe that there are performance issues, we reach for profiling to make sure that it’s not due to the inclusion of the particular library. Any indication of the library being the cause of the bottleneck prompts us to re-read the library documentation to check if we are using the library correctly or reconsider using the library itself.
- When an application has many external dependencies like databases, other services etc. Sometimes it may be difficult to add debug loggers to a poorly performing application to identify a troublesome dependency. Profiling is the best option here since the application does not need to be modified at all to be profiled. Async Profiler can be used in a container too, which makes profiling possible for applications that are in production or staging.
Solving the issue
The right way to solve the issue in our file server would be to fetch the requested file from the filesystem the first time it’s requested and then cache it in memory so that it can be accessed faster for every subsequent request. We can implement this logic ourselves, but let’s check the Vert.x-Web documentation to see if they have any built-in solutions.“Serving static resources
Vert.x-Web comes with an out of the box handler for serving static web resources so you can write static web servers very easily. To serve static resources such as .html, .css, .js or any other static resource, you use an instance of StaticHandler. Any requests to paths handled by the static handler will result in files being served from a directory on the file system or from the classpath. The default static file directory is webroot but this can be configured. … When Vert.x finds a resource on the classpath for the first time it extracts it and caches it in a temporary directory on disk so it doesn’t have to do this each time.” Vert.x StaticHandler documentation StaticHandler looks like the solution to our performance problems! Let’s modify our server code to use it.
package com.example.profilertest;
import io.vertx.core.AbstractVerticle;
import io.vertx.core.Promise;
import io.vertx.core.http.HttpServer;
import io.vertx.ext.web.Router;
import io.vertx.ext.web.handler.FileSystemAccess;
import io.vertx.ext.web.handler.StaticHandler;

public class MainVerticle extends AbstractVerticle {
  @Override
  public void start(Promise startPromise) throws Exception {
    HttpServer server = vertx.createHttpServer();
    Router router = Router.router(vertx);
    /*
     * route any API calls for the endpoint `/files/*` to serve the requested files (if present)
     * from the `files` directory
     */
    outer.route("/files/*").handler(StaticHandler.create(FileSystemAccess.RELATIVE, "files"));
    server.requestHandler(router).listen(8080);
  }
}
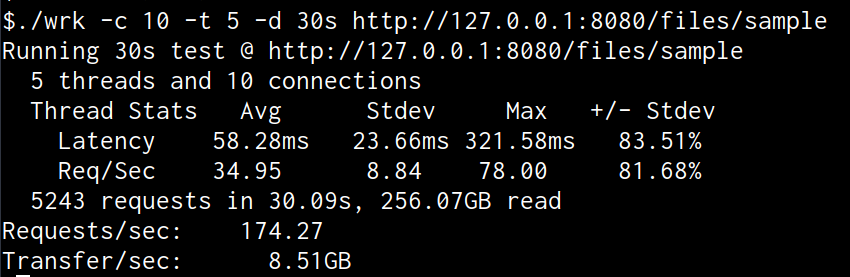
Fig: Using wrk to test the updated API
We’ve got almost a 7x increase in performance! We can profile the application and observe how different the flame graph is from the ‘bad’ implementation.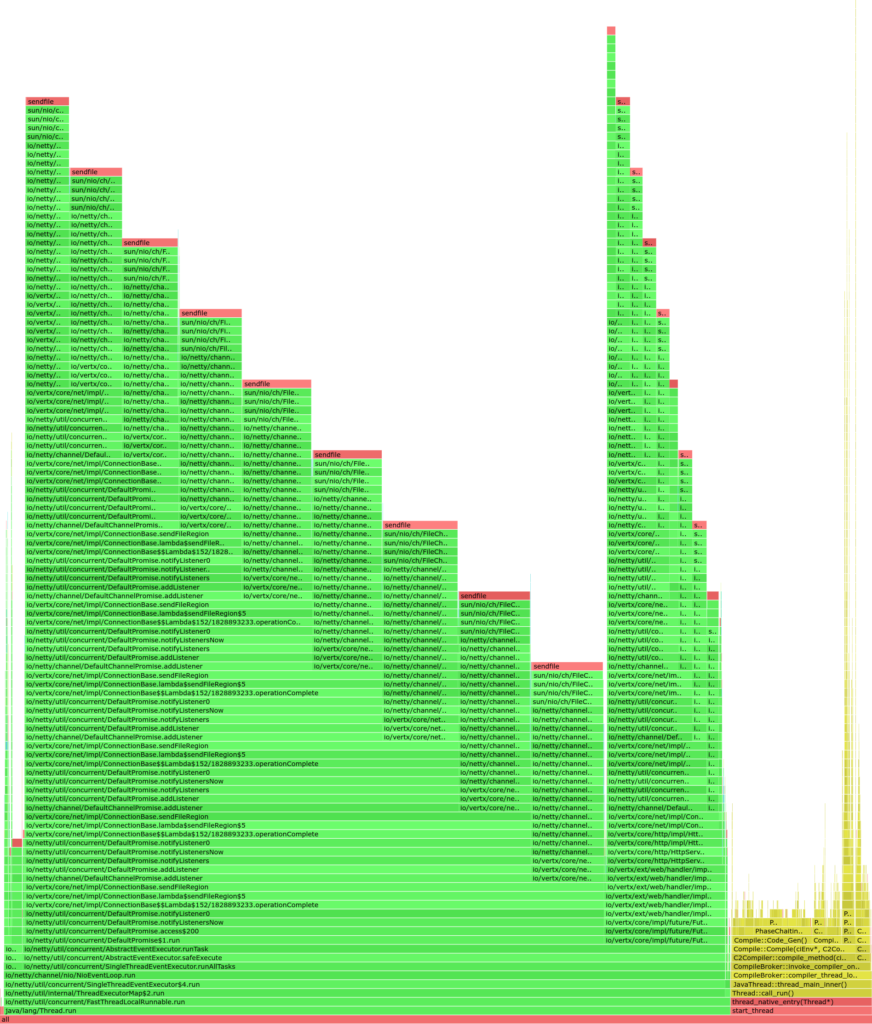
Fig: Flame graph generated from profiling the good implementation of the server
sendfile shows up quite a lot, this is a Linux system call used to zero-copy the file for efficient transmission. Flame graphs were designed to be interactive; you can search for particular method names and click on methods to explore its nested methods more closely. We have linked the flame graphs for the bad and good implementations of the server here so that you can download and play around with them.Conclusion
I hope that through this article, you’ve seen how profiling and Async Profiler can become an essential part of your Java debugging toolkit and even be integrated into your development and testing lifecycle. If you’re interested in understanding how profiling actually works, I can recommend this article that guides you in implementing a toy Java profiler. Author: Bryan Paul Robert Reviewed by: Mahidhar ChellamaniRelated Posts


