
People around the globe, are affected by poor water quality. Potable water scarcity is exacerbated due to poor water quality. It has been observed in some countries that there is a direct correlation between water quality and economic growth [1]. Therefore it is imperative to study and forecast water quality so that timely action could be taken and policy could be framed accordingly. Knowing the water quality beforehand could guide stakeholders like government agencies to identify the reasons for a problem and prevent further contamination.
The river Kaveri was chosen due to its profound importance in the state of Karnataka and also the unique geographical path that it traces, originating from Taala Kaveri in the Coorg District and finding its way into the Bay of Bengal, through Tamil Nadu. Kaveri is the primary source of irrigation, provides water for household consumption and generates electricity [2] for the state of Karnataka.
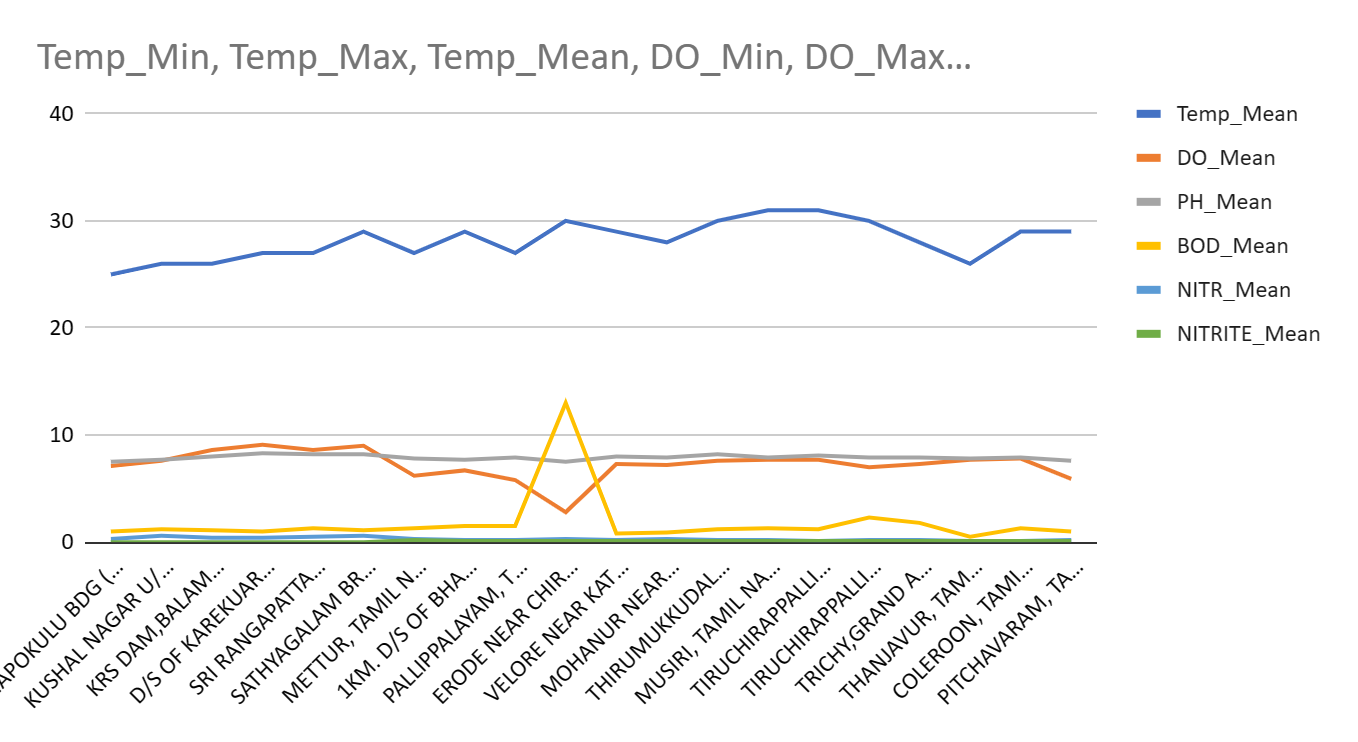
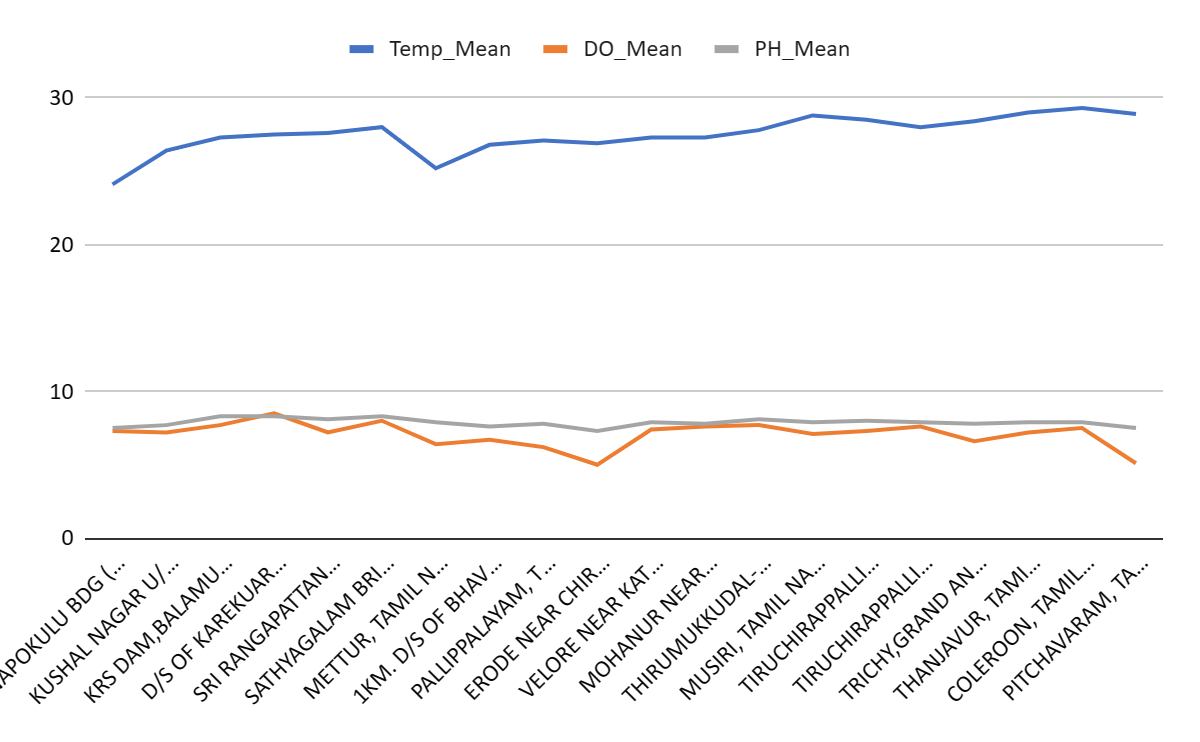
In this project time series modelling is employed to study the quality of the Kaveri River and forecast it. Using historical data collected from the pollution control board 8 parameters of water quality are studied, such as Dissolved Oxygen, Temperature, PH, Conductivity, Biological Oxygen Demand, Nitrate, Nitrite, Faecal Coliform, and Total Coliform.
Four parameters were chosen which are crucial in determining water quality, Temperature, PH, Total dissolved salts, and Turbidity. A sensor which could measure all 4 was put together in the form of an IoT device to acquire real-time data. A dashboard has also been developed that monitors the observed time series and shows different trends for all parameters. The system architecture is shown below in Fig 1.
Fig 1 System Architecture
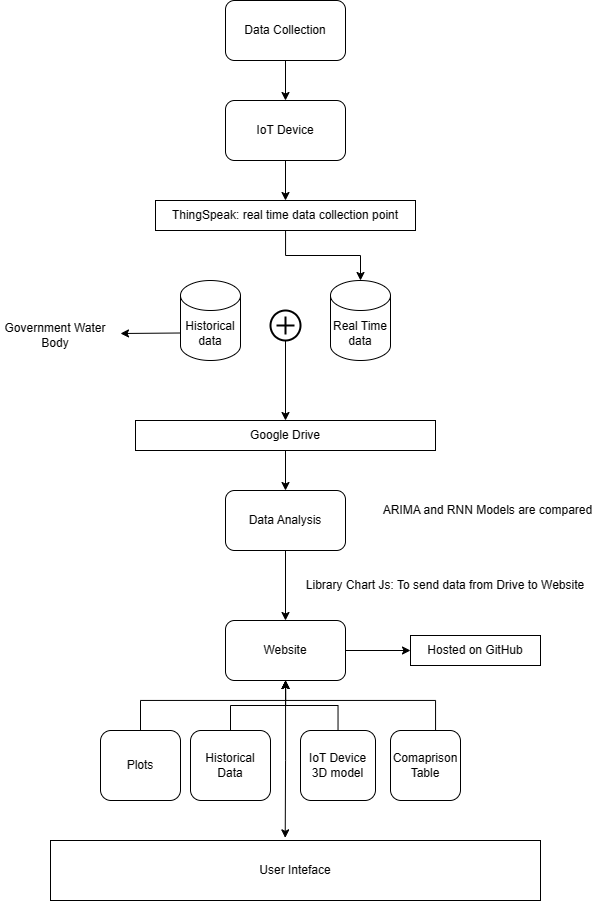
- Data collection and Storage: Real-time parameters data is relayed from the IoT device to the cloud, where it is stored along with the historical data.
- Analysis: Data is analysed, to identify any possible outliers and trends. It is then collated and made available for use.
- Website: Allows for convenient visualization of data and users are able to download it for their own research purposes.
IoT Device
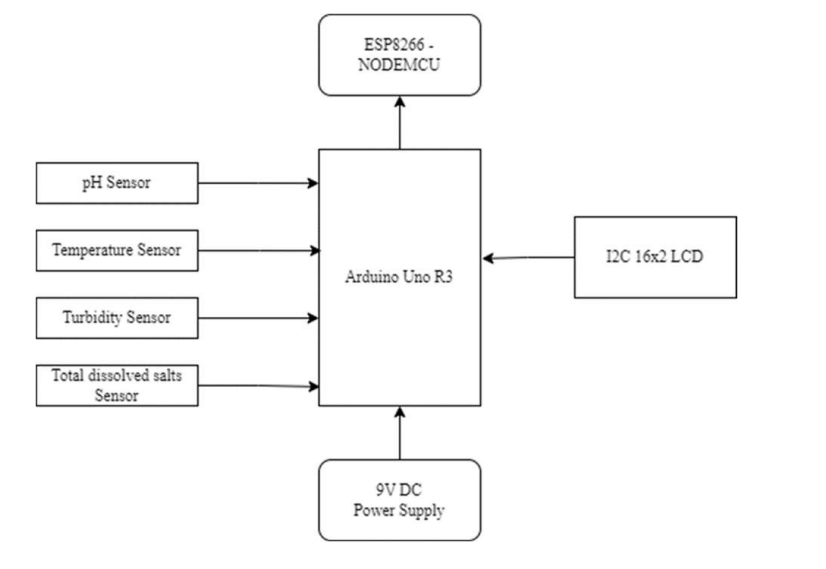
As shown in Fig 2, Arduino UNO along with sensors like the turbidity sensor, temperature sensor, total dissolved salts sensor, and pH sensor were used to build an IoT device for real-time monitoring of water quality parameters in the river. The IoT device provides a convenient and effective solution for continuously monitoring the water quality in the river, allowing prompt detection of any potential issues or changes in the water parameters. This system aids in making informed decisions for environmental management and protection.
Fig 2 Diagram of IoT Device
Recurring Patterns
Preliminary analysis of different water quality parameters allowed us to conclude that there is a seasonal pattern that is evident for most parameters at different checkpoints along the Kaveri River. This was then used to compare different time series models on the historical data and use the best out of them to predict.
Data from 2007, 2008 (more available):
Time Series analysis
RNN: Recurrent Neural Networks (RNNs) are advanced models that excel at modelling sequential data, using feedback loops to consider previous information when making predictions, which is crucial for capturing time-dependent patterns.
ARIMA: Autoregressive Integrated Moving Average (ARIMA) is a prominent method for time series analysis. It involves differencing to make nonstationary data stationary, and the model has components for autoregression (past values) and moving averages (past errors), making it a powerful tool for understanding and forecasting time series data.
The historical data was run with both algorithms. RNN outperformed ARIMA for most of the parameters. This was primarily due to a lack of consistent historical data.
Dashboard:
An interactive dashboard has also been created for users to access and visualize the parameters of the real-time data as well as historical data.
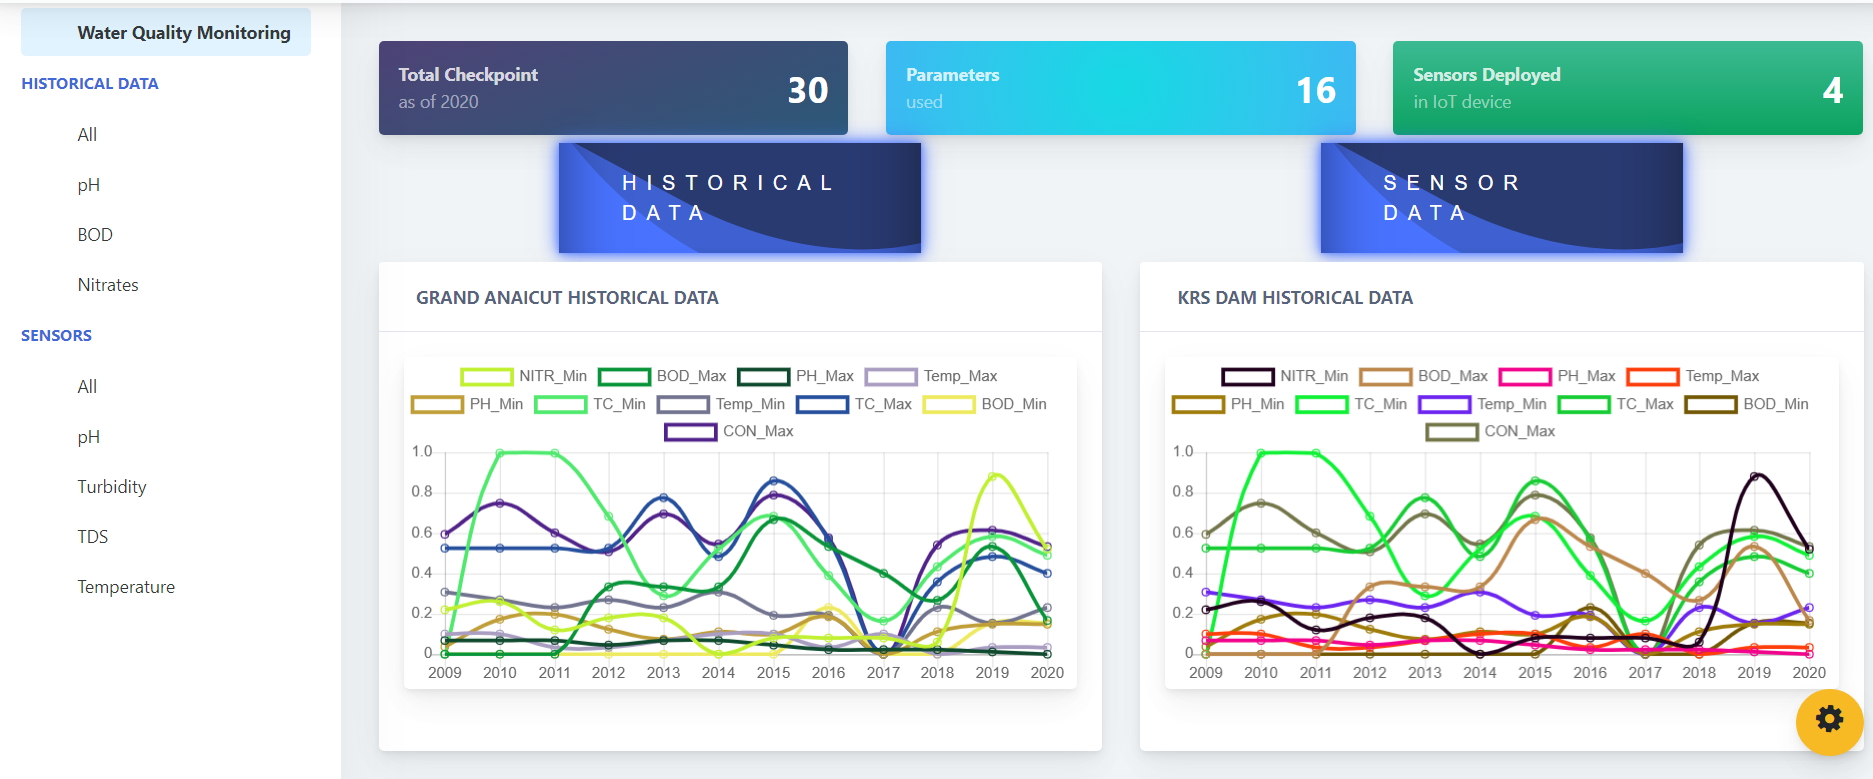
The dashboard allows users to download datasets and use them for their research purposes. The Dashboard can be viewed here: Water Quality Monitoring Dashboard – Kaveri River (arunjoseph19.github.io)
Conclusion:
RNN model works better for time series analysis and future forecasting with the given historical data of River Kaveri. The IoT device serves as a possible deployment device that can be used to receive real-time data from any water body. These predictions can be used to inform decision-making by government agencies, local communities, and other stakeholders concerned with the health of the river.
Future work:
- The IoT device could be used at every checkpoint along the river and provide regular updates to the local authorities.
- An alternative to ThingSpeak platform is a data exchange platform such as IUDX which could be used to share real-time data and also facilitate data exchange between authorities and the general public.
Author:
Arun Josephraj
Associate Software Developer,
IUDX
References
Related Posts


